
On This Page
Immigrant Survey 2025 Report
Immigrant Survey 2025
Immigrant Survey 2023
Immigrant Survey 2023 Report
Further Research Opportunities
Immigrant Survey 2025 Report
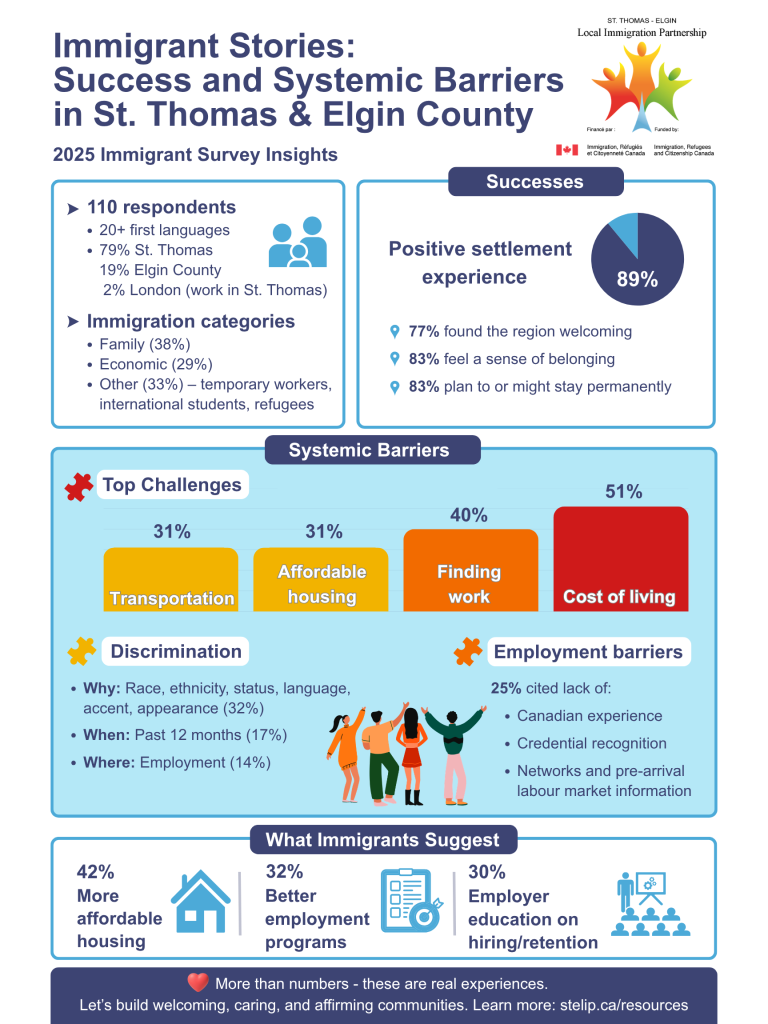
The 2025 Immigrant Survey provides insight into how immigrants and newcomers are building their lives in St. Thomas and Elgin County. Based on responses from 110 participants across diverse immigration pathways, languages, and lengths of time in Canada, the survey explores early settlement experiences, community connection, and the system conditions that shape long-term belonging. Building on STELIP’s 2023 survey, the 2025 report highlights both strengths and ongoing challenges, and includes implications for community action to support welcoming, inclusion, and long-term stability across the region.
Key highlights from the 2025 survey:
- 89% of respondents reported a positive settlement experience.
- Cost of living (51%), finding work (40%), affordable housing (31%), and transportation (31%) were the most common challenges.
- While most respondents felt welcomed, experiences of discrimination were linked to lower feelings of welcome and belonging.
- Employment barriers included lack of Canadian experience, credential recognition, and limited professional networks.
- Respondents identified affordable housing (42%), better employment programs (32%), and employer education (30%) as top priorities for change.
Immigrant Survey 2025

SURVEY DEADLINE EXTENDED UNTIL JULY 10! The 2nd bi-annual Immigrant Survey will be open in June 2025. Make your voice heard! Anyone born outside Canada who lives or works in St. Thomas or Elgin County will be eligible, including:
- Permanent Residents
- International Students
- Refugee Claimants
- Temporary Workers
- Canadian Citizens
The survey will capture information about St. Thomas-Elgin immigrants’ experiences, challenges, and recommendations. We’ll also compare these results to our 2023 survey results to gain a sense of how our immigrant communities are changing over time. The survey results will be used to improve services and programs for immigrants in our community. The survey is voluntary and anonymous; no identifying information will be associated with the survey responses.
Immigrant Survey 2023
The first Immigrant Survey was completed in June 2023. We defined ‘immigrants’ as anyone who was born outside Canada. The survey was open to all immigrants who lived or worked in the St. Thomas and Elgin County, including:
- Permanent Residents
- International Students
- Refugee Claimants
- Temporary Workers
- Canadian Citizens
We asked participants about their experiences, challenges, and recommendations. This findings can be used to inform community planning, policy, and programs. This survey will be repeated every two years to build an understanding of our immigrant communities over time.
It’s important to note that the survey sample size is not large enough to be a statistically significant representation of all immigrants in St. Thomas-Elgin, and, in addition to some known gaps in respondents, there may be additional unknown gaps as well. Nonetheless, these findings still provide important insight into the experiences of some immigrants in our community.
The 2023 Immigrant Survey Report
A total of 99 immigrants participated in the survey. Of this total, 68 completed the full-length survey, and an additional 31 completed a shorter version in English, Spanish or Ukrainian. Most questions were optional, so not all participants answered every question.
Survey Findings Highlight
- 99 survey respondents.
- 71% were racialized.
- 25 different first languages reported.
- Most respondents were from St. Thomas (77%), with 11% from the east Elgin region, and 4% from the central Elgin region.
- Top immigration categories: family category (44%), economic category (20%), international student (9%), other (7%).
- Top challenges: cost of living (34%), finding healthcare (28%), finding work (24%).
- Top suggested solutions: more affordable housing (39%), better programs for immigrants to find work (36%). employer education on hiring and retaining immigrants (29%).
- 37% of respondents experienced discrimination in the past 12 months.
- Almost all the respondents had used at least one service category, which included health, recreation, police, employment, education services and more.
- The services with the highest positive ratings were language interpretation/translation (89% of users rated positively), local municipal government/bylaw (84% of users rated positively), and police (84% users rated positively). The service with the highest negative rating was transportation (76% of users rated negatively).

Further Research
Contact us if you’re interested in being involved or getting more information about future research.
We plan to repeat this survey every two years to build an understanding of our immigrant communities over time.
